Mermaid Diagrams: Syntax, Examples, and Diagrams as Code
Table of contents
Somewhere in your team's wiki there is an architecture diagram that is wrong. Someone drew it in a diagramming tool two years ago, exported a PNG, and pasted the image into the page. The service it describes has since grown a queue, lost a cache, and swapped one database for another. The picture shows none of that, and nobody can fix it, because the editable source lives in a .drawio file on a laptop that was reimaged last spring. The diagram is now a confident, full-color lie, and everyone has learned to ignore it.
A Mermaid diagram fails differently. It is not an image; it is a few lines of text that a renderer turns into a picture. That difference sounds small and changes everything: the diagram lives in the same repository as the code, it changes through the same pull request, and anyone who can read Markdown can fix it in ten seconds. This guide covers the syntax, gives you a copy-paste example for every diagram type worth knowing, shows where Mermaid renders, and then names the one problem it does not solve.
What is a Mermaid diagram?
A Mermaid diagram is a diagram generated from plain text. Mermaid is an open-source, JavaScript-based tool that reads a small, Markdown-inspired syntax and renders it into a flowchart, sequence diagram, class diagram, or one of a dozen other types. You write the diagram as code, the renderer draws it, and the text is the source of truth. The Mermaid project describes itself plainly: "Create diagrams and visualizations using text and code."
Here is the entire idea in five lines:
flowchart LR
    A[Write text] --> B[Mermaid renders it]
    B --> C[Diagram appears inline]
    C --> D[Edit the text, repeat]
That block is not a screenshot of a diagram. It is the diagram. Paste it into a GitHub pull request, an Obsidian note, or a Notion page and it draws itself. Because it is text, it diffs cleanly in review, it survives a copy-paste, and it never rots into an uneditable binary blob. If your team already treats documentation as code that lives in the repo, Mermaid is the missing piece that lets diagrams live there too. Start free if you want a place to keep the diagrams and notes that do not belong in a code repo but still need to stay honest.
Why diagrams as code beats a drawing tool
The pitch for Mermaid is not that it draws prettier boxes than a dedicated tool. It usually does not. The pitch is about what happens to the diagram after you make it.
A diagram drawn in a GUI tool is a binary file or an exported image. It cannot be reviewed in a pull request in any meaningful way (a reviewer sees "image changed," not what changed). It drifts on its own timeline, separate from the code. And when the one person who owns the source file leaves, the diagram freezes forever. That is a single point of failure dressed up as a picture.
A Mermaid diagram is text, so it inherits every good habit your codebase already has:
- It diffs. A reviewer sees exactly which edge you added or which node you renamed, right next to the code change that motivated it.
- It reviews. The diagram change rides in the same pull request as the code, so a pull request that people actually read catches a diagram that no longer matches reality.
- It versions.
git blameworks on a diagram. You can see when the flow changed and why, and roll it back if the change was wrong. - It renders anywhere. No plugin, no license, no export step. The same fenced code block draws itself in every tool listed below.
This is why Mermaid shows up wherever engineers already write architecture decision records, design docs, and technical specs. A design doc that embeds a Mermaid sequence diagram stays in sync with itself: change the flow in the text, and the picture changes in the same commit.
Mermaid syntax basics
Every Mermaid diagram is a fenced code block that starts with a diagram type. In Markdown, you open a fence with the word mermaid:
```mermaid
flowchart TD
    Start --> Stop
```
Inside, the first token declares the type (flowchart, sequenceDiagram, classDiagram, and so on). For flowcharts, the second token sets direction: TD or TB (top-down), LR (left-right), RL, or BT. After that, you describe nodes and the connections between them.
Three rules cover most of what you will write day to day:
- Nodes get an ID and an optional shape.
A[Square],B(Rounded),C{Diamond},D((Circle)). Reuse the ID to refer to the same node again. - Edges connect nodes.
A --> Bis a solid arrow,A --- Ba plain line,A -.-> Bdotted,A ==> Bthick. Add a label withA -->|yes| B. - Comments start with
%%and are ignored by the renderer.
That is enough to draw the majority of diagrams that ever appear in an engineering doc. The rest is knowing which diagram type fits the job.
Mermaid diagram examples: a copy-paste cheatsheet
Below is one working example of each diagram type you are most likely to need, with a one-line note on when to reach for it. Copy any block into a Mermaid-aware editor and it renders as-is.
Flowchart (a process, a decision, a pipeline):
flowchart TD
    A[Open pull request] --> B{CI passes?}
    B -->|yes| C[Request review]
    B -->|no| D[Fix and push]
    D --> B
    C --> E[Merge]
Sequence diagram (who calls whom, and in what order):
sequenceDiagram
    participant U as User
    participant API
    participant DB
    U->>API: POST /login
    API->>DB: check credentials
    DB-->>API: ok
    API-->>U: session token
Class diagram (data model, object relationships):
classDiagram
    class Note {
        +String title
        +String body
        +verify()
    }
    class Desk {
        +String name
    }
    Desk "1" --> "*" Note : contains
Entity relationship diagram (database schema):
erDiagram
    DESK ||--o{ NOTE : contains
    NOTE ||--o{ TAG : has
    NOTE {
        uuid id
        string title
        datetime updated_at
    }
State diagram (the lifecycle of a thing):
stateDiagram-v2
    [*] --> Draft
    Draft --> InReview: open PR
    InReview --> Draft: changes requested
    InReview --> Merged: approved
    Merged --> [*]
Gantt chart (a schedule or roadmap):
gantt
    title Release plan
    dateFormat YYYY-MM-DD
    section Build
    Spec        :done,    a1, 2026-09-01, 3d
    Implement   :active,  a2, after a1, 5d
    section Ship
    Review      :         a3, after a2, 2d
    Deploy      :         a4, after a3, 1d
Mindmap (branching notes, an outline):
mindmap
  root((Note taking))
    Capture
      Voice
      Web clips
    Organize
      Tags
      Links
    Maintain
      Verification
You will not memorize all of this, and you do not need to. Keep the block that matches your current job, and let the official Mermaid syntax reference fill in the rest when a diagram gets complicated.
Which Mermaid diagram type should you use?
Reaching for the wrong type is the most common Mermaid mistake. Here is the short version.
| You want to show | Use | Because |
|---|---|---|
| A process or decision | flowchart | Boxes and arrows with branching, the workhorse |
| Who calls whom, in order | sequenceDiagram | Time runs top to bottom; makes call order explicit |
| Data model / relationships | classDiagram | Fields, methods, and how objects relate |
| A database schema | erDiagram | Tables, keys, and cardinality (one-to-many) |
| The lifecycle of a thing | stateDiagram-v2 | States and the events that move between them |
| A schedule or plan | gantt | Tasks over dates, with dependencies |
| Branching ideas | mindmap | An outline that fans out from a center |
If you cannot decide between a flowchart and a sequence diagram, ask whether order in time is the point. If it is, use a sequence diagram. If the point is branching and decisions, use a flowchart.
Where Mermaid diagrams render
Mermaid's real advantage is reach. The same code block draws itself across most of the tools an engineer already uses, with no export step. GitHub added native Mermaid support to Markdown in 2022, and the rest of the ecosystem followed.
| Tool | Support | Notes |
|---|---|---|
| GitHub | Native | In Markdown files, issues, PRs, and comments |
| GitLab | Native | Markdown and wikis |
| Obsidian | Native | Renders in preview and reading mode |
| Notion | Native | Use the /code block, language Mermaid |
| VS Code | Extension | Markdown Preview Mermaid Support, plus many others |
| MkDocs / Docusaurus | Plugin | Standard for docs-as-code sites |
| Mermaid Live Editor | Web | Paste, render, export SVG or PNG |
The practical upshot: you write a diagram once, in text, and it shows up correctly in your repo, your notes app, and your published docs site without you touching it three times. That is the property a screenshot can never have.
Where Mermaid diagrams still go stale
Here is the part the tutorials skip. Diagrams as code fixes where a diagram lives and how it changes. It does not fix whether it is still true.
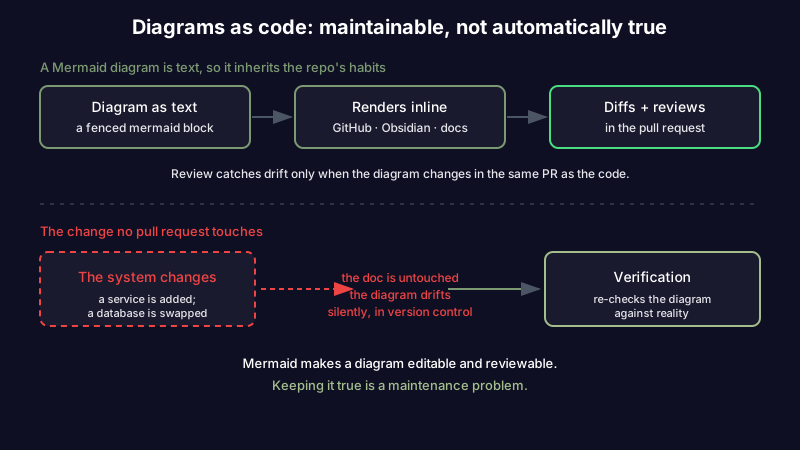
A Mermaid diagram in a design doc is a claim about the system, the same way a sentence in the doc is a claim. When the code changes, the diagram can drift just like prose drifts. The pull request review catches drift only if the diagram happens to change in the same PR as the code it describes, and it often does not: someone adds a new service, wires it up, ships it, and never opens the doc where the old architecture diagram still smiles up at the next new hire. The text is version-controlled and reviewed and completely out of date. This is documentation rot, and it does not care whether your diagram is a PNG or a fenced code block.
So diagrams as code is a real upgrade and only half the job. It makes a diagram editable and reviewable, which the old PNG never was. It does nothing on its own to tell you the diagram no longer matches the running system. That second half, keeping a diagram true after you draw it, is a maintenance problem, and maintenance is where knowledge quietly decays in every tool that stops at "we wrote it down."
That gap is what Scribelet is built to close. Keep your diagrams and the notes around them in one place, and background agents watch the sources they depend on, so when the thing a diagram describes changes, you get a diff instead of a silent lie in the wiki two years from now. Mermaid gets the diagram into a form you can maintain. Scribelet is the part that actually maintains it.
Mermaid diagram FAQ
What is a Mermaid diagram? A diagram generated from plain text using Mermaid, an open-source JavaScript tool. You write a few lines in a Markdown-inspired syntax and a renderer turns them into a flowchart, sequence diagram, or other type. The text is the source, so the diagram versions, diffs, and reviews like code.
Can ChatGPT generate Mermaid diagrams? Yes. Because Mermaid is text, any capable language model can produce a valid Mermaid block from a description, and you can paste the result straight into a renderer. It is worth checking the output: models occasionally invent syntax or mislabel edges, and a diagram that renders is not the same as a diagram that is correct.
Is Mermaid free? Yes. Mermaid is open source under the MIT license, and the Mermaid repository on GitHub is public. Some hosted editors and commercial products build on it, but the core tool and syntax cost nothing.
Mermaid vs PlantUML? Both render diagrams from text. Mermaid uses a lighter, Markdown-friendly syntax and renders natively in GitHub, GitLab, Obsidian, and Notion with no server. PlantUML supports more diagram types and finer control, at the cost of a heavier syntax and, often, a rendering server. For most engineering docs, Mermaid's native support wins.
Getting started
Mermaid turns a diagram from a picture you cannot edit into text you can. Pick the diagram type that matches the job, write it in the fenced mermaid block, and let it render in the repo, the pull request, and the docs site from a single source. That alone removes an entire category of stale, uneditable diagrams from your documentation.
The half that Mermaid does not cover is keeping the diagram true once the system moves on. Try Scribelet free: keep your diagrams, notes, and their sources together, and let background verification tell you when the thing a diagram describes has changed, so the picture in your docs stops drifting into fiction.
Share this article