Obsidian Graph View: What It's Actually For (2026)
Table of contents
The Obsidian graph view is the screenshot that sold half its users on the app. A galaxy of glowing dots, every note a star, every link a thread of light. It looks like a second brain made visible. Then you open it on your own vault, see a tangled hairball or a handful of lonely points, and quietly close it again. If that is you, you are not using it wrong. You are using it the way almost everyone does.
This guide is the honest version of the Obsidian graph view: what it genuinely helps with, the exact settings that turn it from a toy into a tool, which plugins extend it, and the point at which it is just decoration. If you are still learning the basics, the full guide to using Obsidian covers the five steps that matter first. This one assumes you already have a vault and want to know whether the pretty picture is worth your time.
What is the Obsidian graph view?
The Obsidian graph view is a core plugin that draws your vault as a network: each note is a node, each internal link between notes is a line, and notes with more connections render as larger nodes. You open it from the graph icon in the left ribbon, or by running "Open graph view" from the command palette (Cmd/Ctrl + P). There is nothing to install; it ships with the app.
There are two versions, and conflating them is the first reason people decide the graph is useless:
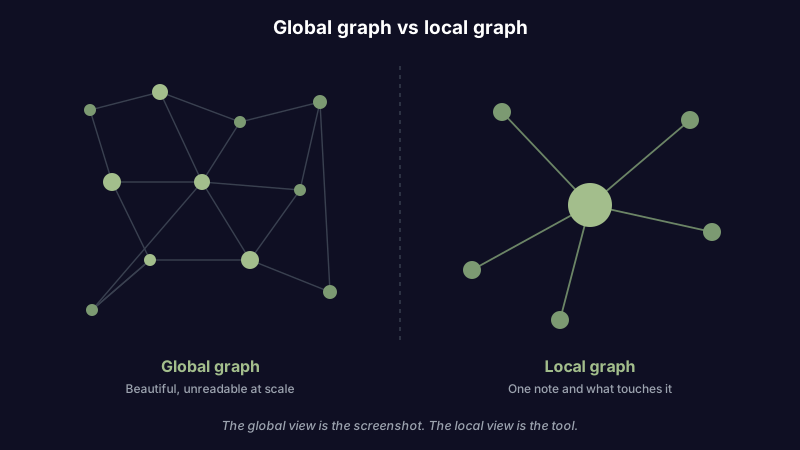
- Global graph shows your entire vault at once. Its job is the wide view: broad clusters, hub notes, and the orphans drifting at the edges with no links at all.
- Local graph shows only the active note and the notes within a few link hops of it. Its job is the close view: what sits around the thing you are reading right now.
The global graph is the one in all the screenshots. The local graph is the one that earns its place in a daily workflow. Keep that distinction and most of the confusion disappears.
If you are weighing Obsidian against other apps partly because of this feature, know that the graph is built on plain Markdown files and wikilinks you own, not a proprietary database. You can also try Scribelet free if what you actually want is the connections without the untangling, which is the real subject of the last section below.
The honest answer: useful tool or pretty gimmick?
Search "obsidian graph view" and you find two kinds of content. One kind is breathless: watch your knowledge light up. The other kind, which tends to come from people who have used it for a year, asks a blunter question. A widely shared video on the topic is titled "Useful Tool or Marketing Gimmick?", and a long-running thread on the Obsidian forum is called "What's the point of the graph view?" Even its defenders defend it carefully, as in Eleanor Konik's essay "It's Not Just a Pretty Gimmick".
The honest answer is that the global graph is mostly a gimmick and the local graph is mostly a tool. The global view is beautiful and nearly useless once your vault passes a few hundred notes, because a hairball of two thousand dots tells you nothing you can act on. The local view, pointed at one note, answers a real question you ask constantly: what else did I write that touches this?
So the useful framing is not "should I use the graph view" but "which graph, aimed at which job." There are three jobs where it genuinely pays off.
Three jobs the Obsidian graph view is actually good for
1. Finding orphan notes
An orphan is a note with no links in or out. It is the note you captured in a hurry and never connected to anything, which means you will never stumble back into it. Orphans are where good ideas go to die quietly.
The global graph is the fastest way to find them. Open it, and in the Filters panel turn on the toggle for existing files and orphans, or search with -path: queries to strip out the folders you do not care about. The orphans float alone at the edges with no threads attached. Spend ten minutes a week linking the worthwhile ones into your existing notes and deleting the junk, and you have turned the graph into a maintenance tool instead of a wallpaper. This is the same staleness problem that makes a vault quietly rot; more on that in the piece on keeping an Obsidian vault from going stale.
2. Spotting clusters and gaps
Zoom out on a healthy vault and you see clumps: a dense knot around one project, a tight ball of book notes, a sparse region you have barely developed. The Groups panel lets you color notes by a search query, a tag, or a folder, which is what makes clusters legible instead of random. Color your work notes blue and your reading notes green, and the shape of your attention over the last few months becomes something you can actually see.
The gaps matter as much as the clusters. A topic you thought you had covered showing up as three isolated dots is a prompt: these should be linked, or there is a missing note that should tie them together. Used this way, the graph is a thinking aid rather than a screensaver.
3. Exploring around a single note
This is the local graph, and it is the one worth keeping open. Pin the local graph next to a note you are actively working in, set the depth to one or two hops, and toggle whether you want incoming links, outgoing links, or both. Now, as you read, you can see and jump to the notes immediately connected to this one without hunting through search or folders.
It is a navigation tool first and a visualization second. For anyone building a web of linked notes in the zettelkasten tradition, the local graph is the closest thing Obsidian has to walking the slip-box by hand.
Graph view settings that actually matter
Most of the sliders in the graph panels are cosmetic. A few change what the graph can do. Here is the short list worth learning, drawn from the four control groups the official Obsidian help documents.
| Panel | Setting | What it does |
|---|---|---|
| Filters | Orphans, existing files, tags, search query | Decide what appears at all; the single biggest lever for a readable graph |
| Groups | Color by query, tag, or path | Turn an undifferentiated cloud into labeled clusters you can read |
| Display | Node size, link thickness, text fade, arrows | Make hubs legible and show link direction; mostly polish |
| Forces | Center force, repel force, link force, link distance | Spread a dense graph out so clusters separate instead of overlapping |
The two that change outcomes are Filters and Groups. Filters decide whether you are looking at your whole vault or just the part you care about, and Groups decide whether the result means anything. Forces are useful for one thing: cranking up repel force and link distance on a crowded global graph so the clusters pull apart enough to see. Everything in Display is decoration you can safely ignore until the rest is working.
One limitation the settings cannot fix: the built-in graph does not remember a layout. Close it and reopen it, and the dots rearrange themselves. There are no pinned nodes and no stable positions, which is a recurring complaint on the forum, and the reason the plugins below exist.
Plugins that extend the Obsidian graph view
If you have decided the graph is worth investing in, the community has filled most of the gaps in the core version. These are the ones that actually show up when people search for a better graph, and what each adds. For the wider picture, see the full roundup of the best Obsidian plugins.
| Plugin | What it adds | Use it when |
|---|---|---|
| Extended Graph | Node images, custom shapes, richer styling of the core graph | You want the core graph to look and read better without changing tools |
| Graph Banner | A local graph embedded in the header of each note | You want the local graph always visible while you read |
| Graph Save | Saves and restores graph layouts | The missing-layout problem is your main frustration |
| Excalibrain | A structured, directional graph (parents, children, siblings) | You want hierarchy and relationships, not a physics simulation |
| InfraNodus | AI analysis of clusters, gaps, and bridges between topics | You want the graph to tell you where the gaps are, not just show them |
The pattern across all of them is telling. Every popular graph plugin exists to add structure, persistence, or analysis, which are exactly the three things the core graph lacks. That is a strong hint about what the default graph is missing.
When the Obsidian graph view is just decoration
It is worth being honest about the failure mode, because most people hit it. On a large vault the global graph becomes an unreadable hairball, and no amount of force-tuning fixes a network of two thousand densely linked nodes. The famous screenshots are almost always either a small vault or a carefully filtered slice, not someone's real daily-driver graph at full size.
The deeper issue is that the graph shows you topology, not meaning. It can tell you two notes are linked. It cannot tell you why, or which of the forty links off your hub note is the one you need right now. The graph is mostly a toy for the first few months while the backlinks panel quietly does the real work. If you find yourself opening the global graph to admire it rather than to answer a question, that is the tell: it has become decoration.
None of this is a reason to abandon Obsidian. The app is excellent, the links are the point, and the graph is a minor feature oversold by its own marketing. If you want a frank comparison of where it fits, the piece on Obsidian alternatives walks through what you would actually miss, graph included.
If you want connections without the hairball
Step back and ask what the graph is really promising: to surface the connections between your notes so that related ideas find each other instead of scattering. The visual graph is one way to deliver that, and for most people it is the least practical one, because it hands you a picture and makes you do the interpreting.
There is a different approach, and it is the one Scribelet takes. Instead of drawing a map and asking you to read it, Scribelet keeps the parts of the graph idea that work and drops the part that does not. On the free plan you get full wikilinks and a backlinks panel, so every note shows what points at it without any setup. On the Pro plan, an AI auto-linker reads your notes and suggests the semantic connections you would otherwise have to spot yourself, and a daily digest surfaces the themes tying recent notes together. Either way the connections arrive as something you can act on, not as dots you have to untangle. If you are exploring AI approaches inside Obsidian for the same reason, that is the gap they are all trying to close.
The graph view is a beautiful answer to a real question: how are my ideas connected? It is just not a very useful one at scale. If the connections matter more than the picture, and you want them to follow you across every device the way a note app that works everywhere should, try Scribelet free and let the links find you instead of the other way around.
Share this article